Tesis de Inversión MTY FOOD GROUP (MTY)

07/12/2021
1. RESUMEN
MTY FOOD GROUP. Ticker (MTY) cotización actual 57$ canadienses
-
Empresa de franquicias de comida rápida.
-
Ingresos recurrentes debido a su modelo de negocio basado en royalties.
-
CAGR de los ingresos 23% en los últimos 10 años.
-
Modelo resiliente a las crisis financieras.
-
Excelente track record realizando adquisiciones.
-
Equipo directivo alineado.
-
Mercado fragmentado con posibilidades de crecimiento.
1.1. Historia
MTY Food, fundada en 1979 por Stanley Ma, es una de las franquicias de restaurantes más grandes de Canadá y se está convirtiendo en un actor importante en Estados Unidos a través de una estrategia de fusiones y adquisiciones con excelente track record, financiada principalmente por deuda y FCF, logrando en la actualidad contar con 80 marcas distintas entre las que abarcan, comida rápida, helados y marcas similares.
Cabe destacar que MTY recibe el 90% de sus ingresos por medio de royalties, debido a que la empresa no opera los restaurantes, esto hace que su modelo de negocio sea más atractivo y con menor riesgo operativo.
La siguiente imagen resume los hitos más importantes de la empresa:

2. ANÁLISIS DEL NEGOCIO
En este apartado se explicará de forma detallada el perfil de negocio de MTY, sus fuentes de generación de ingreso y la estrategia de M&A que ha seguido la empresa en los últimos años.
2.1. Perfil de negocio
El negocio de MTY consiste en franquiciar y operar ubicaciones de propiedad corporativa de restaurantes de servicio rápido y de comidas informales, así como la venta de productos minoristas. La empresa también opera una planta de proceso de alimentos, y un centro de distribución.
La empresa cuenta con numerosos conceptos de restaurantes, lo cual le permite posicionarse en una amplia gama de sectores demográficos, geográficos y económicos.
En la siguiente imagen se muestran las distintas de marcas de MTY, las cuales protegen a la empresa de cambios en las preferencias del consumidor:

Las marcas que tienen más peso en las ventas del sistema (ventas de todos los restaurantes existentes, incluyendo los que han cerrado o abierto durante el ejercicio en curso, así como las ventas de nuevos conceptos adquiridos a partir de la fecha de cierre de la transacción y en adelante) son: Papa Murphy's y Cold Stone Creamery. Actualmente estas dos marcas representan más del 45% de las ventas del sistema, generando aproximadamente el 31% y el 18% de las ventas respectivamente.
Taco Time, Thai Express y Baja Fresh Mexican Grill son el tercer, cuarto y quinto concepto más grande en términos de ventas de sistemas, cada una genera menos del 10% de las ventas de la red.
Por otro lado, es importante mencionar que la empresa tiene cierta estacionalidad en las ventas, esto es debido a que la venta de golosinas y batidos congelados son mayores en el Q2 y Q3, además, las ventas de pizza presentan una mayor demanda en Halloween, en la siguiente imagen se aprecia de forma clara esta estacionalidad.

En lo que respecta al tipo de ubicaciones del grupo MTY, estas se pueden clasificar en:
-
Patios de comidas, torres de oficinas y centros comerciales.
-
Frente a la calle.
-
Formato no tradicional dentro de aeropuertos, hospitales, campus, tiendas de conveniencia, supermercados, cines, parques de diversiones y en otros lugares o sitios compartidos de minoristas.
Hay que señalar que MTY ha realizado un cambio en su modelo comercial en los últimos años, donde ha habido una inclinación hacia un tipo de ubicación en concreto de los restaurantes y, por ende, en el porcentaje que representan en las ventas del sistema.
En el siguiente cuadro podemos observar esta evolución:

Se aprecia una tendencia hacia las tiendas que están Frente a la calle, la cual es la más atractiva entre las tres posibles, ya que así lo demuestran los porcentajes de ventas que son capaces de generar. Su peso dentro de las ventas es superior al papel en porcentaje de tiendas, lo que se traduce a que son más rentables para la franquicia (recordando que sus royalties dependen de forma proporcional a las ventas brutas).
Luego, otro factor importante a tener en cuenta en MTY, es el porcentaje de cierres netos en el año (excluyendo restaurantes adquiridos por operaciones de M&A), el cual ha pasado de estar entorno al 0% en 2010, a aproximadamente el 5,6% en 2020, aunque este último año jugó un papel fundamental la pandemia.
En la siguiente tabla se aprecia el cierre neto de locales en el año 2018 y 2019:

Si tenemos en consideración la transición del modelo comercial de la empresa antes mencionada, la cual se basa en quitar peso a los restaurantes en centros comerciales (modelo en declive en ventas), es coherente que en los últimos años se hayan producido cierres en los locales menos rentables y es de esperarse que cuando las ubicaciones en centros comerciales tengan un menor peso, el cierre neto de tiendas disminuya.
2.2. Fuentes de generación de ingresos:
Operación de franquicia
Los acuerdos de franquicias que MTY suele llevar a cabo con los franquiciados pueden oscilar en función del tipo de ubicación de las tiendas, involucrando acuerdos más longevos para aquellos con ubicaciones tradicionales (entre 10 y 15 años) o más reducidos en tiempo como para los que no tienen una ubicación tradicional (de 3 a 5 años).
Cuando una persona adquiere una franquicia del grupo, inicialmente reporta unos ingresos que pueden variar entre $ 25,000 y $ 50,000 para ubicaciones tradicionales y entre $ 5,000 y $ 17,500 para ubicaciones no tradicionales. Además, y en conformidad con el contrato de franquicia, la Compañía cobrará una tarifa de regalías continua de cada franquiciado de aproximadamente el 3% al 7% de las ventas brutas.
La obligación por parte del franquiciado de reportar las ventas brutas que han generado están estipuladas por contrato, e incluso, puede llegar a tener un estimado gracias al sistema de punto de venta (“POS”) que se instalan en las tiendas. , Para otros conceptos, las tarifas están integradas en el precio de los productos y la Compañía las recauda a través de distribuidores
Sin embargo, las fuentes de ingreso de la Compañía no se quedan limitadas a las que ya he comentado. De forma adicional, MTY se encarga de negociar con los proveedores mejores precios y reparte un porcentaje de ese margen que consigue con el franquiciado, mientras que la otra parte es un ingreso por dicha negociación.
Por último, como aspecto a resaltar es que en el acuerdo de franquicia también se puede incluir la capacitación de los empleados, asistencia técnica y otros servicios que la compañía brindará a los franquiciados a cambio de un coste ligeramente mayor, el cual, suele ser atractivo ya que permite “asegurar” las directrices de la empresa matriz.
En resumen, los ingresos de la Compañía provienen de las siguientes fuentes:
1. Los ingresos por franquicias
Durante los años 2019 y 2020, los ingresos en esta categoría representaron el 50% y 52% de los ingresos consolidados respectivamente, representando más del 90% del EBITDA de la empresa.
Los ingresos por franquicia internamente están estructurados en varias partidas, todos derivados de las operaciones de franquicia, como se describe a continuación:
1.1. Tarifas de regalías: Como se ha mencionado recientemente, MTY cobra una tarifa de regalías continua de cada franquiciado. La cual generalmente oscila entre el 3% y el 7% de las ventas brutas según los conceptos y, en general, se paga de forma semanal o mensual.
1.2. Tarifas de franquicia inicial: Este ingreso es un único pago y no es recurrente como el caso de los Royalties. Sin embargo, MTY cobra una tarifa de franquicia inicial que generalmente varía entre $ 25,000 y $ 50,000 ($5,000 a $ 17,500 para ubicaciones no tradicionales) al comienzo del término inicial del contrato de franquicia.
Los honorarios iniciales de la franquicia se reconocen linealmente durante la vigencia del contrato de franquicia a medida que se cumple la obligación de desempeño relacionada con los derechos de franquicia. La amortización comienza una vez que el restaurante ha abierto.
1.3.Tasas de licencia maestra: Este tipo de ingresos suele darse cuando existe una persona o entidad interesada en adquirir los derechos territoriales de un espacio donde aún no se encuentra el grupo con el fin de expandir la marca. MTY cobra una tasa de licencia maestra en el momento que otorga estos derechos.
1.4. Tarifas de renovación: En el momento que caduca el contrato acordado entre franquicia y franquiciado, el último tiene la posibilidad de renovar las condiciones o extender su condición de franquiciado de MTY. En ese caso, la empresa cobra una tarifa al volver a otorgar una franquicia vencida. Dependiendo del concepto, la tarifa varía de $ 1,000 a $ 5,000 por año renovado.
1.5. Ingresos por venta de ubicaciones de franquicias: En algunos casos, MTY gestiona la construcción de un nuevo restaurante, que luego se entrega "llave en mano" al franquiciado una vez finalizado.
Los ingresos por construcción y renovación de restaurantes se reconocen cuando se culminan los trabajos de construcción y renovación.
1.6. Ventas de bienes y equipos: De forma indirecta, otra fuente de ingreso para el grupo es que los franquiciados deben comprar ciertos bienes y equipos, que serán usados en sus ubicaciones de la Compañía. Estos artículos que MTY le proporciona a los franquiciados, los vende con una ganancia.
Los ingresos se reconocen cuando se entregan los bienes. MTY también genera algunos honorarios de administración por la reventa de servicios a sus franquiciados.
1.7. Ingresos por rentas: En ciertos casos, la compañía puede obtener ingresos por rentas en ciertas propiedades, arrendamientos que posee e ingresos por arrendamiento de firmas. Esto es así ya que, como empresa de gran tamaño, es capaz de negociar mejores condiciones en contratos de alquiler “long-term” que si lo hiciera directamente el franquiciado. Una parte de esa mejora de condiciones que obtiene, es cobrada por MTY.
Explicado con otras palabras, MTY puede arrendar los locales en los que llevará a cabo la actividad el franquiciado y, posteriormente, subarrendarlos cobrando algo por ello.
1.8. Ingresos por tarjetas de regalo: MTY reconoce los ingresos por roturas sobre una base de reconocimiento prorrateada, que se basa en el patrón histórico de canje de las tarjetas de regalo. Dicha tasa de no canje puede rondar el 10-15% de estas tarjetas de regalo.
1.9. Consideraciones de proveedores: MTY recibe consideraciones de proveedores. Las contribuciones de los proveedores se reconocen en el mes en que se obtienen.
1.10. Tarifas de transferencia y otras tarifas: MTY cobra una tarifa por la transferencia de una franquicia, documentando los cambios al contrato de franquicia y otros documentos, proporcionando planos y especificaciones para el diseño de la tienda y para la supervisión de la construcción.
1.11. Honorarios contables: En algunas marcas del grupo, MTY es capaz de llevar la contabilidad en nombre de los franquiciados, a cambio del cobro de los respectivos honorarios.
2. Ingresos por procesamiento, distribución y venta minorista de alimentos:
Durante los años 2019 y 2020, los ingresos por procesamiento y distribución de alimentos representaron el 21% y el 17% de los ingresos consolidados, respectivamente.
2.1. La Compañía obtiene ingresos de la producción de una variedad de productos alimenticios: Los ingresos por procesamiento de alimentos se reconocen cuando los bienes se han entregado a los usuarios finales.
2.2. Ingresos por distribuciones: La Compañía obtiene ingresos por la distribución de alimentos y suministros para restaurantes a sus ubicaciones de Valentine y Casa Grecque. Los ingresos se reconocen una vez que los bienes se han entregado en la ubicación de la franquicia.
2.3. Ingresos minoristas: la Compañía obtiene ingresos por la venta de productos en tiendas minoristas. Los ingresos minoristas se reconocen cuando los bienes se han entregado.
3. Ingresos de ubicaciones de propiedad corporativa:
MTY no sólo opera con franquiciados, sino que, en algunos casos, los restaurantes son poseídos y gestionados por el mismo grupo.
Los ingresos de las ubicaciones de propiedad corporativa se registran cuando se prestan los servicios. Los ingresos de las ubicaciones de propiedad corporativa han representado el 16% y el 13% de los ingresos totales en el año 2019 y 2020, respectivamente.
4. Ingresos de fondos promocionales:
Las contribuciones al fondo promocional se basan en un porcentaje de las ventas brutas según lo informado por los franquiciados. Ocasionalmente, la empresa cobra una comisión por la administración de los fondos promocionales. Según los contratos de franquicia, los franquiciados deben pagar una tarifa que oscila entre el 1% y el 4% de las ventas brutas, según el concepto, al fondo promocional.
Los ingresos por fondos promocionales han representado el 16% y el 17% de los ingresos totales para 2019 y 2020 respectivamente.
2.3. M&A
MTY tiene una sólida trayectoria en el despliegue de capital para realizar transacciones que incrementan el flujo de efectivo. Muchas marcas que adquiere MTY necesitan un trabajo importante desde una perspectiva de integración y optimización de procesos, es allí donde la administración tiene una larga historia de transacciones exitosas y, en última instancia, de cosechar los flujos de efectivo recurrentes de las regalías.
Las adquisiciones son la estrategia de crecimiento central que la empresa seguirá persiguiendo en el futuro, por lo que en este apartado se explican las últimas transacciones y los múltiplos que la empresa ha pagado, además se calcula de forma aproximada la rentabilidad que la empresa obtiene por medio de estas operaciones.
En la siguiente imagen podemos observar las más de 50 adquisiciones que ha realizado la compañía, donde nos centraremos en las últimas operaciones de M&A más importantes como Kahala Brands Ltd en 2016, Imvescor Restaurant Group en 2018, Papa Murphy’s en 2019 y la adquisición más reciente Kuto Comptoir a Tartares en 2021.

1. Kahala Brands Ltd: El 26 de julio de 2016, MTY anunció que había completado la adquisición de Kahala Brands Ltd por un precio de compra de $ 394.2 millones, ejecutada con la emisión de 2,253,930 acciones de MTY y el pago de $ 212 millones en efectivo. Al cierre, de la operación Kahala franquiciaba y operaba aproximadamente 2.879 tiendas en todo el mundo; con 18 marcas en 27 países y generaba aproximadamente $ 950 millones en ventas del sistema.
El propósito de la transacción fue solidificar la presencia de MTY en los Estados Unidos, ya que se convertiría en una de las principales plataformas de crecimiento para las marcas ya existentes de MTY.
Las tiendas adquiridas en la transacción Kahala Brands Ltd., han generado un crecimiento positivo en MTY, impulsado principalmente por el sólido desempeño de Cold Stone Creamery ( una de las 5 marcas que se integraron con esta adquisición) la cual representa alrededor del 10% de las ventas del sistema de MTY.
Por esta operación la empresa pagó múltiplos EV/EBITDA pre-sinergias de 12,5x y post-sinergia aproximadamente 11,5x.
2. Imvescor Restaurant Group: El 1 de marzo de 2018, la empresa, a través de la fusión de una subsidiaria de propiedad total con Imvescor Restaurant Group Inc. (“IRG”), adquirió todas las acciones en circulación de IRG. La contraprestación total por la transacción fue de $ 250,8 millones, de los cuales $ 53,1 millones se liquidaron en efectivo y el resto en acciones.
Al cierre, IRG operaba 5 marcas en Canadá y tenía 261 locales en funcionamiento, generando un EBITDA de 18,5 millones. Las marcas integradas en el grupo fueron: Baton Rouge, Score's, Toujours Mike's, Pizza Delight y por último Ben & Florentine.
En esta adquisición se pago múltiplos EV/EBITDA de 13x pre-sinergias y 10x incluyendo sinergias.
3. Papa Murphy’s: es la última adquisición más grande que ha realizado MTY, la cual representa cerca del 30% de las ventas. Se llevo a cabo el 23 de mayo de 2019, la Compañía, a través de la fusión de una subsidiaria estadounidense de propiedad total con Papa Murphy's Holding Inc. (“PM”), adquirió todas las acciones en circulación. La contraprestación total por la transacción fue de $ 255,2 millones.
Papa Murphy’s, operaba 1.301 tiendas en franquicia y 103 tiendas de propiedad corporativa en los EE. UU., Canadá y Emiratos Árabes Unidos. Generaba 28,8 millones en EBITDA y la operación se cerró por unas 8,5x EV/EBITDA.
El concepto de Papa Murphy’s es interesante explicarlo ya que puede considerarse único. La empresa se centra en vender pizzas crudas para que los consumidores la horneen en casa, los pedidos se pueden realizar en la tienda o en línea y todos los productos que utiliza la empresa son muy frescos, esto se demuestra con el hecho de que no utilizan neveras.
Como contra este modelo de negocio compite también con los supermercados aunque la calidad de la pizza es el factor diferenciador en este modelo de negocio.
4. Kuto Comptoir a Tartares: en lo que respecta a adquisiciones, esta es la más reciente que ha realizado MTY. Se anunció el 1 de diciembre de 2021, donde MTY adquirió a Kuto Comptoir a Tartares, una empresa de alto crecimiento con sede en Quebec.
El resto de adquisiciones que MTY ha realizado en los últimos años se han pagado múltiplos entre 6x y 8x EV/EBITDA y 0,42x ventas del sistema, de media. El ROIC generado por estas operaciones puede estimarse de la siguiente forma:
Si consideramos la inversión total en adquisiciones que la empresa ha realizado en un periodo determinado y cuánto han contribuido en el flujo de efectivo, podemos concluir que desde el 2009 las adquisiciones han tenido una conversión en flujo de caja medio de 12,61%.
Por último, las adquisiciones han contribuido en que el número de ubicaciones de la empresa, mantenga una tendencia al alza a pesar de como se ha mencionado anteriormente, una tendencia de cierres netos de locales en los últimos años, como consecuencia del cambio de modelo comercial.

No debemos olvidar que el año 2020 se vio afectado profundamente por la pandemia, la cual provocó mayores cierres en todo el sector de la restauración. Sin embargo, esta crisis puede aportar oportunidades a MTY en el medio plazo para adquirir empresas a múltiplos razonables, como ya lo demostró luego de la crisis financiera de 2008.
3. EVOLUCIÓN DE LOS INGRESOS
En este apartado veremos la evolución de los ingresos de MTY y qué factores han sido determinantes para alcanzar el crecimiento actual.
En primer lugar, debemos tener en cuenta que estamos ante una empresa de gran calidad y muy resistente ante las crisis, así lo demuestra su evolución de ingresos entre el 2006 y 2010 donde, a pesar de la crisis financiera mundial, fue capaz de triplicar sus ingresos, aumentando sus ventas de 22 millones a 66,89 millones.

Este crecimiento se genero principalmente gracias a operaciones de M&A donde la empresa supo aprovechar la debilidad financiera de muchas empresas para adquirirlas.
Sin embargo, no todo es positivo en la evolución de las ventas de la empresa, ya que el crecimiento orgánico histórico de la empresa es ligeramente negativo en los últimos 10 años (-1%, -0,5%). A pesar de ello, a partir del 2018 con el nombramiento de Eric Lefebvre como CEO, se tiene como objetivo que MTY se concentre mucho más en el lado orgánico del negocio. Este factor no era la principal prioridad en el pasado.

Luego, habiendo entendido que la empresa debe su crecimiento a operaciones de M&A, podemos analizar que en los últimos 10 años la empresa ha aumentado sus ventas con un CAGR del 23,1%, tal y como se aprecia en la siguiente tabla:

Además, las ventas del sistema aumentaron en el mismo periodo de 527 millones, a más de 3500 millones de dólares canadienses, tal y como se expone en la siguiente gráfica:

Si relacionamos las ventas del sistema con el número de ubicaciones en la actualidad, se puede llegar a la conclusión de que los ingresos medios por restaurante han aumentado desde $250.000 en 2011 hasta más de $500.000 en la actualidad. En ese mismo periodo, la empresa destinó aproximadamente 1200 millones en adquisiciones, multiplicando el numero de ubicaciones por más de 3 veces.
Respecto a la distribución geográfica de las ventas, esta pueda apreciarse en el siguiente cuadro:

A pesar del rápido crecimiento en Estados Unidos producto de la integración de Papa Murphy 's Pizza y Cold Stone Creamery, la cuota de mercado actual de la empresa en Norteamérica sigue siendo inferior al 1% del mercado.
3. EVOLUCIÓN MARGEN EBITDA
En lo que respecta al margen EBITDA de MTY, este se encuentra en la actualidad en torno al 28%, como podemos observar en la siguiente tabla:

Aunque, parece en primera instancia que los márgenes han ido disminuyendo desde 2013, esto no es del todo cierto. Para comprender esto, debemos tener en cuenta que MTY tiene diversos segmentos de negocio, cada uno de ellos con sus propios márgenes EBITDA. En la siguiente gráfica se ve el peso de cada segmento de negocio sobre los ingresos totales de la empresa

El segmento de distribución y procesamiento de alimentos, el cual tiene menores márgenes, ha aumentado considerablemente su peso en los ingresos globales de la empresa. Dando lugar a que los márgenes globales disminuyan sobre el papel y parezca una empresa de peor calidad, siendo en este caso lo opuesto.

Los márgenes de las franquicias no han sufrido contracción, al contrario se encuentran en el nivel más alto de los últimos 10 años.
4. EVOLUCIÓN DE LA COTIZACIÓN

La evolución de la cotización de MTY, ha sido increíble desde su salida a bolsa en la década de los 90' s. Logrando convertirse en una empresa 100 bagger, debido a su excelente trayectoria de generación de ingresos recurrentes por medio de royalties y con una estrategia de M&A brillante, donde el equipo gestor ha generado mucho valor para todos los accionistas.
5. ACCIONARIADO Y EQUIPO DIRECTIVO
Stanley Ma, presidente y director: Stanley Ma fundó la empresa y dejó el cargo de director ejecutivo en noviembre de 2018. Actualmente, es el presidente de MTY. Si bien permanece activo en la búsqueda, desarrollo y negociación de fusiones y adquisiciones, ya no participa en las operaciones diarias. Ma es el mayor accionista de la empresa y posee el 16,2% de las acciones en circulación equivalente a 4,005,643 acciones.
Eric Lefebvre, director ejecutivo y director: Eric ha estado en MTY desde 2009. Comenzó ejerciendo el cargo de Vicepresidente de Finanzas, luego paso a ser Director Financiero en el periodo entre junio de 2012 y noviembre de 2018 y, desde entonces, ejerce sus funciones como Director Ejecutivo de la compañía. Antes de estar en MTY, el Sr. Lefebvre ocupó cargos de liderazgo en Bell Aliant y Gaz Metro. En cuanto a su profesión es contador profesional colegiado y tiene una Maestría en Administración de Empresas.
Cabe destacar que en el momento en el que se nombró a Eric como CEO de la empresa, se le otorgó un paquete de Stock Options para mantenerlo alineado con los objetivos y el crecimiento de la empresa. Por lo que actualmente posee no sólo 9.137 acciones, sino que además posee un paquete de opciones sobre 240.000 acciones.
Ren e St-Onge, directora financiera : Se incorporó a MTY en 2012 y reemplazó al Sr. Lefebvre como directora financiera de la empresa en noviembre de 2018. Al igual que Eric, posee un paquete de opciones sobre 40.000 acciones. Lo que alinea sus intereses con los de los accionistas.
Por otro lado, en base a los salarios y compensaciones que reciben los principales directivos se aprecia que existen remuneración por objetivos.

Para 2021, los incentivos de efectivo a corto plazo se basan en lograr ciertos niveles de crecimiento orgánico en EBITDA, en unidades de negocio o marcas, objetivos de EBITDA y crecimiento orgánico de los flujos de caja libres, así como en la apertura de nuevas tiendas.
En cuanto a el nivel de salarios, Eric posee el mayor salario base bruto, siendo este de 500.000 dólares canadienses, el resto de directivos se encuentran en una franja de 250.000 a 300.000.
Si comparamos lo que finalmente ganan los directivos, podemos concluir que existe un mayor interés por que la evolución de la empresa vaya bien ya que cerca del 20% de las acciones en circulación se encuentran entre los directivos.
Por otro lado mencionar que existen instituciones con un gran número de acciones como es el caso de Fidelity Management & Research and Company LLC y Fidelity Investments Canada, las cuales poseen el 13,29% y 10,29% de las acciones respectivamente.
6. ANÁLISIS DEL MERCADO
La industria de la comida rápida y la restauración, está creciendo a más del 3% anual y se espera que así continúe en los próximos años.

Además podemos observar que el mercado de Estados Unidos donde la empresa tiene menos del 1% de cuota de mercado es 10 veces más grande que el mercado en Canadá, lo que aporta muchas posibilidades a la empresa de aumentar su participación.
En la siguiente gráfica se observa la principal contribución a este crecimiento reflejada en el porcentaje de gasto de estadounidenses y canadienses en restaurantes:

Por otro lado, respecto al COVID 19, todo el sector ha sufrido grandes caídas en sus ventas a causa de los cierres obligatorios, incluso algunos estudios afirman que entre el 20 y 25% de los restaurantes en Norteamérica quebraron a causa de la pandemia.
Esta reducción en la oferta de restaurantes se está haciendo notar en las ventas y beneficios de las empresas de restauración, como es el caso de MTY que, con menos restaurantes que en 2019, está generando mayor beneficio.
En lo que respecta a las restricciones durante la pandemia, Estados Unidos ha tomado medidas mucho menos restrictivas que Canadá, lo que se ha notado en la evolución de las ventas durante el año. Es de esperarse que las restricciones en Canadá disminuyan en el transcurso de los próximos trimestres, donde existe aun una mayor cantidad porcentual de restaurantes cerrados.
Sin embargo, se puede concluir que el entorno de mercado continúa siendo difícil, con mucha incertidumbre acerca de nuevas cepas de coronavirus que puedan causar nuevos cierres obligatorios. A pesar de ello, los restaurantes que mejor se adapten pueden salir favorecidos e incluso aprovechar el momento para hacer operaciones de M&A.
7. VENTAJAS COMPETITIVAS
Diversidad de marcas: La gran diversidad de conceptos le permite a MTY posicionarse en una amplia gama de sectores y segmentos de la población, además de tener la posibilidad de recaudar información para instalar nuevos conceptos en ubicaciones ya presentes.
Estructura de costes: A diferencia de un restaurante que tiene costes fijos muy altos como es el caso del alquiler del local o número de personal fijo, MTY no tiene que alquilar estos locales, ya que, como se explicó anteriormente se subarriendan al franquiciado. El coste variable de la comida en caso de inflación, puede llegar a beneficiar a la empresa porque cobran un royalty sobre los ingresos pero sin asumir el aumento del coste de la comida.
Equipo gestor: El equipo gestor ha demostrado ser de gran valor para todos los accionistas, logrando escalar el negocio a través de operaciones de M&A con un track record exitoso.
Modelo de negocio resiliente a las crisis: En los años 2008 y 2009, durante la crisis financiera las ventas comparables de la empresa, solo cayeron 1,9% mientras que las ventas totales aumentaron un 55%, esto se genero por la oportunidad de adquirir empresas a muy buenos precios.
8. Riesgos
Ventas comparables negativas: Como se ha explicado a lo largo de la tesis de inversión, MTY tiene ventas comparables negativas en los últimos años, sin embargo esto no ha impedido que el precio de la acción se haya multiplicado por varias veces debido a su fortaleza de generar crecimiento inorgánico por operaciones de M&A. No obstante, considero un riesgo que las ventas comprables lleguen a un nivel superior al -3%.
Cierre netos de locales: Excluyendo las adquisiciones de restaurantes que la empresa ha realizado, los franquiciados han tenido cierres netos durante los últimos años, lo que significa que no todos los franquiciados están teniendo éxito en sus restaurantes. Aunque hay que destacar que las franquicias que se han cerrado son menos rentables que las nuevas que se abren.
Covid 19: Nuevas cepas de coronavirus pueden causar nuevos cierres obligatorios de restaurantes como fue el caso en 2020, esta situación puede deteriorar aún más el sector y provocar la quiebra de muchos franquiciados de MTY.
Riesgo M&A: MTY como se ha explicado, centra su crecimiento en realizar operaciones de M&A, por lo que, a pesar de tener un equipo gestor con un gran track record, con más de 50 adquisiciones exitosas, siempre existe un riesgo ligado con este tipo de operaciones.
9. BUSINESS PLAN
En este apartado, estableceré mis estimaciones para el periodo 2022-2026 con la finalidad de proyectar los estados financieros de la compañía y obtener el valor intrínseco de la misma, por medio de Valoración por múltiplos comparables.
9.1. Estimaciones 2022 - 2026
Las hipótesis de valoración las estableceré en dos escenarios, el primero de ellos lo llamaré “escenario normal”, al cual le asignó una mayor probabilidad de ocurrencia y, en segundo lugar, un “escenario desfavorable” en el que se pondrá a prueba el crecimiento de la empresa.
Antes de comenzar con los escenarios, quiero explicar diversos detalles que tiene MTY, los cuales son importantes conocer para poder realizar una valoración de forma correcta.
El CAPEX de la empresa es prácticamente nulo o negativo, esto se debe a que, cuando un franquiciado deja de pagar o cierra su restaurante, MTY mantiene el restaurante gratis, pudiendo vender a otro franquiciado y beneficiarse del traspaso del local a coste cero o como segunda opción puede vender sus activos y llegar a un acuerdo con el arrendador principal, ya que MTY ha realizado muchas mejoras al local.
En la siguiente imagen extraída del informe anual de 2020, se puede apreciar este caso de CAPEX cero o negativo:

Observamos, que en ambos años (2020 y 2019) la partida “Proceeds on disposal of property, plant and equipment, assets held for sale and intangible assets” es mayor que las adiciones en planta y equipo y activos intangibles. Esto se debe a la explicación que he dado anteriormente.
Por otro lado, hay que tener en cuenta la política de adquisiciones de la empresa y la conversión en flujo de efectivo de estas operaciones, tal y como se analizó en el apartado “2.3 estrategias de M&A de la empresa”.
Escenario Normal:
A continuación, mencionaré los factores claves de este escenario:
Ingresos: MTY es una empresa que ha aumentando sus ventas a un CAGR del 20% en los últimos 10 años, por lo que en este escenario normal, voy a proyectar las ventas a un 15% anual, teniendo en cuenta que el COVID ha dejado muchas empresas deterioradas y MTY puede aprovecharse para realizar adquisiciones.
En lo que respecta al crecimiento orgánico, este lo considero en torno al 0%.
Deuda: Hay que destacar que en la deuda no he tenido en cuenta los arrendamientos ya que MTY los subarrienda a los franquiciados y respecto a su proyección, estará ligada a las operaciones de M&A de la empresa.
M&A: He tenido en consideración como he mencionado anteriormente un crecimiento inorgánico del 15%, por lo que la empresa seguirá desplegando capital hacia operaciones de M&A, en las que voy a estimar que MTY pagará por adquisición, una media de 7x EV/EBITDA pre-sinergias. Además se ha tenido en consideración el FCF que la empresa genera durante el año para hacer frente a estas adquisiciones y las limitaciones que existen según los pactos.
CAPEX: Como se ha explicado, el CAPEX es muy bajo cercano al 0, por lo que en este escenario he considerado una inversión equivalente al 1% de las ventas
Márgenes: En este escenario considero un margen EBITDA en línea con los últimos años en torno al 30%.
Escenario Desfavorable:
Los factores claves de este escenario son los siguientes:
Ingresos: En este escenario, contemplaré un entorno más difícil para la empresa, donde el crecimiento orgánico se sitúa de media en -0,5% y de forma inorgánica crezca solo al 7-8%.
Deuda: Hay que destacar que en la deuda no he tenido en cuenta los arrendamientos ya que MTY los subarrienda a los franquiciados y respecto a su proyección, al tener un menor crecimiento inorgánico podrá destinar gran parte del FCF a pagar deuda, por lo que es de esperarse en este escenario que la empresa termine el año 2026 con caja neta.
M&A: He tenido en consideración como he mencionado anteriormente un crecimiento inorgánico del 7-8%, por lo que la empresa seguirá desplegando capital hacia operaciones de M&A, en las que voy a estimar que MTY pagará por adquisición, una media de 7 veces EV/EBITDA pre-sinergias.
CAPEX (sin cambios al escenario anterior): Como se ha explicado el CAPEX es muy bajo cercano al 0, por lo que en este escenario he considerado una inversión equivalente al 1% de las ventas
Márgenes (sin cambios al escenario anterior): En este escenario considero un margen EBITDA en línea con los últimos años en torno al 30%.
9.1. Proyecciones 2022 - 2026
ESCENARIO NORMAL

Como se aprecia en las proyecciones de la cuenta de pérdidas y ganancias, el EBITDA se ha incrementado en 151 millones, producto de adquisiciones, donde si establecemos una media de 7 veces EBITDA por cada una de ellas, llegaríamos a una inversión aproximada de 1061 millones en operaciones de M&A.
Luego, el FCF durante el periodo de proyección ha sido de 1009 millones, incrementándose en 118 millones desde el año 2022 al año 2026, donde se consideró la rentabilidad histórica de las adquisiciones.
En la siguiente tabla resumen se muestra la proyección de los principales parámetros financieros:

La deuda, podemos estimarla estable durante este periodo, ya que las adquisiciones proyectadas son cubiertas prácticamente en su totalidad con el FCF generado.
ESCENARIO DESFAVORABLE

En este escenario, la empresa tiene un crecimiento orgánico ligeramente negativo por lo que producto de adquisiciones el EBITDA se incrementó en 50,3 millones hasta el periodo finalizado en 2026. Contemplando el mismo múltiplo EV/EBITDA que en el escenario anterior llegamos a la conclusión que se necesita una inversión aproximada de 360 millones en operaciones de M&A.
Sin embargo, al contrario del escenario "normal", el FCF generado anualmente por MTY, le permite a la empresa realizar estas adquisiciones y destinar cerca de 70 millones anuales al pago de deuda.

La empresa terminará con una caja neta de 70 millones en 2026.
9.2. Múltiplos Comparables
En este apartado, se analizarán las empresas comparables a MTY, tanto en Canadá como en Estados Unidos, con la finalidad de estimar los múltiplos medios a los que cotizan estas empresas.
* Es importante destacar que, el estudio se ha llevado a cabo considerando la media de los múltiplos en los últimos 5 años (EV/EBITDA y P/FCF), ya que con las condiciones actuales de mercado y las grandes inyecciones de liquidez que se han producido desde el 2020, muchas de las empresas comparables a MTY han tenido una expansión sin precedentes de sus múltiplos.

En este estudio, podemos observar cómo MTY siempre ha cotizado con descuento respecto a comparables, además de las empresas mencionadas en el estudio se pueden añadir otras empresas en Canadá, aunque de menor capitalización como:
-
Pizza Pizza Royalty: la cual a través de su subsidiaria, Pizza Pizza Royalty Limited Partnership, es propietaria y franquicia de restaurantes de servicio rápido bajo las marcas Pizza Pizza y Pizza 73 en Canadá. También venden alimentos y bebidas. Al 31 de diciembre de 2020, la compañía tenía 749 restaurantes en el grupo de regalías. Pizza Pizza Royalty Corp. Fue fundada en 1967 y tiene su sede en Toronto, Canadá.
Cotiza de media a 13x EV/EBITDA y 18x P/FCF.
-
Boston Pizza Royalties Income Fund, opera como franquiciador de pizzerías y restaurantes de pasta para cenas informales. A partir del 1 de enero de 2021, el sistema de franquicias de la compañía constaba de 387 restaurantes en Canadá. Boston Pizza Royalties Income Fund se fundó en 2002 y tiene su sede en Richmond, Canadá.
Cotiza de media a 13x EV/EBITDA y 17x P/FCF.
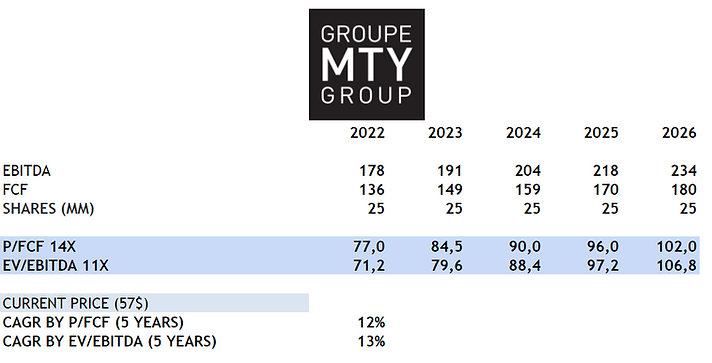
9.3. Valoración
Escenario Normal:
Luego de haber analizado los comparables de MTY en Norteamérica, he decidido valorar a la empresa a 14x EV/EBITDA y 17x P/FCF, siendo esta su media histórica.
A pesar de que las empresas comparables cotizan a múltiplos mayores, es mas sensato utilizar los múltiplos que acabo de mencionar, ya que hay que destacar que estas otras empresas cuentan con mayor capitalización de mercado y con un mayor seguimiento de los analistas.

Escenario desfavorable
En este escenario, debido a un menor crecimiento de la empresa, aplicaré múltiplos de 11x EV/EBITDA y 14x P/FCF.
10. CONCLUSION
Luego de haber analizado MTY en profundidad, puedo concluir que estamos ante una empresa de gran calidad, con un modelo de negocio con ingresos recurrentes muy resistente ante las crisis, además el equipo directivo se encuentra alineado con los intereses de los accionistas y esta formado por excelentes profesionales que han sido capaces de llevar a cabo mas de 50 operaciones de M&A de forma exitosa.
La empresa opera en un mercado muy fragmentado por lo que aun queda mucho margen para asignar capital y crear valor, respecto a los factores de riesgo como las ventas comparables negativas, la entrada de Eric como nuevo CEO, tiene el objetivo de centrarse en el crecimiento orgánico y no solo el inorgánico como se venia haciendo hasta el 2018.
Por ultimo, la valoración por múltiplos comparables arroja rendimientos positivos em ambos escenarios "normal" y "desfavorable", con rendimientos anualizados a 5 años de doble digito.
*La Tesis de Inversión de MTY FOOD GROUP, fue publicada en esta pagina web el 07/12/2021, y en caso de necesitar una actualización por publicaciones de resultados de la empresa o hechos destacables del sector, se dejara un enlace directo al final de esta tesis.
Disclaimer
Las publicaciones de esta pagina web no son un consejo de inversión. Todos los contenidos de este sitio web y el boletín, y todas las demás comunicaciones y correspondencia de su autor, son solo para fines informativos y educativos y en ningún caso, ya sea expreso o implícito, se considerarán consejos de inversión, legales o de cualquier otra naturaleza. Haga su propia investigación y diligencia debida.